
Coliving vs. Traditional Rental: Which Is the Better Investment?
Reviewed for accuracy
Mayank Pokharna, founder of Everything Coliving, reviewed this article. Basis of expertise: 11+ years operating and researching coliving; advisory work with 60+ operators across 14+ countries; primary source data from the EC operator dataset (500+ surveys). Financial and regulatory figures cross-referenced with JLL, CBRE, Cushman & Wakefield, and Knight Frank published research.
Recommended Tools
Free interactive tools related to this article.
ROI Calculator
Estimate potential returns and payback periods for coliving.
Try it free →Operating Budget Template
Build a comprehensive operating budget for your property.
Try it free →Pricing Optimizer
Find the optimal pricing strategy for your coliving rooms.
Try it free →Vacancy Cost Calculator
Quantify the true cost of empty rooms in your property.
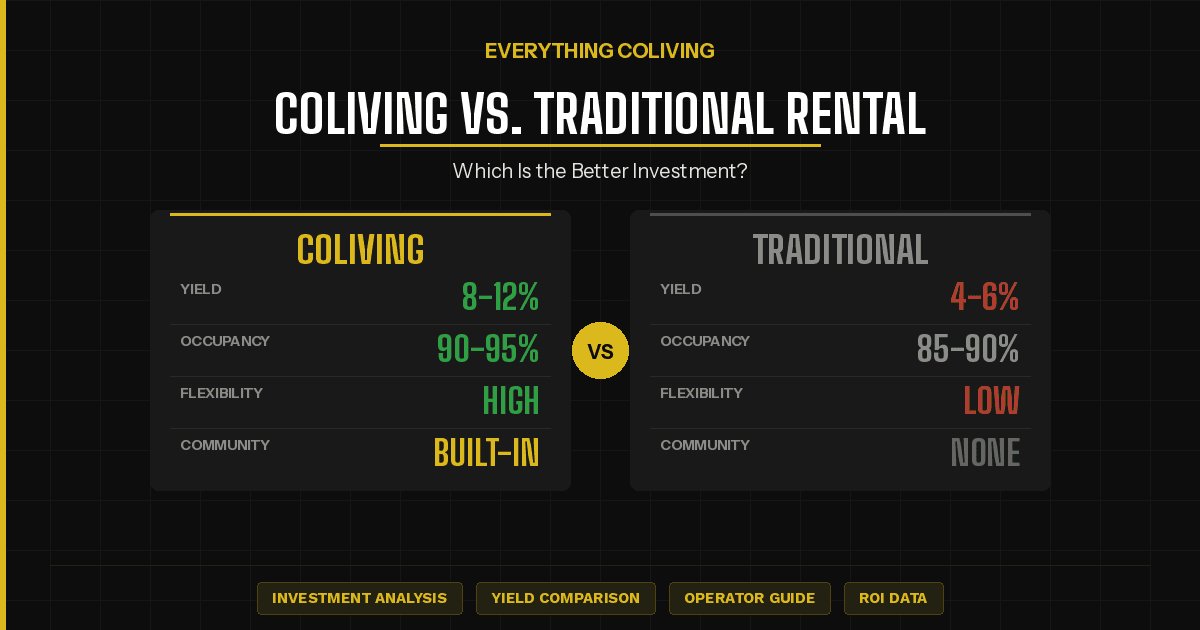
Try it free →Coliving vs. Traditional Rental: Which Is the Better Investment?
Real estate investors increasingly face a choice: stick with the traditional buy-to-let model or venture into coliving. Both have merits, but they are fundamentally different business models with different risk profiles, returns, and operational demands.
Revenue Comparison
Traditional Rental
Revenue is straightforward: one unit, one tenant, one monthly rent. A 3-bedroom apartment in a major city might rent for $3,000 per month.
Coliving
The same 3-bedroom apartment, configured as coliving with 4-5 beds, could generate $4,500-6,000 per month. The per-bed pricing model typically generates 40-80% more revenue than traditional renting from the same square footage.
But revenue is not profit. Coliving has higher operating costs that eat into the revenue premium.
Cost Comparison
Traditional Rental Costs
- Mortgage and property taxes
- Insurance
- Maintenance (typically 1-2% of property value annually)
- Property management (8-12% of rent if outsourced)
- Vacancy costs (typically 5-8% of annual rent)
- Turnover costs (cleaning, minor repairs between tenants)
Coliving Costs
All of the above, plus:
- Furniture and furnishing (initial investment of $3,000-8,000 per room)
- Higher utility costs (included in rent, 15-25% of revenue)
- Faster furniture replacement (3-5 year cycle vs. tenant-provided)
- Community manager labor (the single largest additional cost)
- Community programming budget
- Technology (PMS, smart locks, high-speed internet)
- Higher insurance premiums
- More frequent cleaning and maintenance
- Marketing and resident acquisition costs
Profitability Analysis
Net Operating Income (NOI)
Traditional rentals typically achieve NOI margins of 55-70% of gross revenue. Coliving typically achieves 30-45% NOI margins, though on higher gross revenue. The result is that well-operated coliving often produces 15-30% higher NOI in absolute dollars from the same property.
Cash-on-Cash Returns
Traditional rentals in major markets typically deliver 4-8% cash-on-cash returns. Coliving properties, given higher revenue, typically deliver 8-15% cash-on-cash returns. However, coliving requires higher initial capital investment for furnishing and setup.
Risk Comparison
Traditional Rental Risks
- Tenant default (mitigated by security deposits and screening)
- Extended vacancy
- Major maintenance issues
- Market rent declines
- Regulatory changes (rent control, eviction restrictions)
Coliving Risks
All of the above, plus:
- Higher resident turnover
- Community management challenges
- Regulatory uncertainty (coliving-specific regulations are still evolving)
- Operational complexity
- Brand and reputation risk
- Furnishing depreciation
Risk Mitigation
Coliving's per-bed model actually reduces some risks. If one resident leaves, you lose 20-25% of the unit's revenue rather than 100%. Diversified income across multiple residents provides more stable cash flow.
Operational Demands
Traditional Rental: Passive
Find a tenant, collect rent, handle occasional maintenance. Can be almost entirely hands-off with a property manager.
Coliving: Active
Resident screening, community management, event programming, maintenance coordination, cleaning schedules, technology management, and marketing. Coliving is a hospitality business, not a passive investment.
The Hybrid Approach
Some investors hire coliving operators to manage their properties through management contracts. The investor provides the real estate, the operator provides the expertise. Typical management fees are 15-25% of revenue.
Who Should Choose What?
Traditional Rental Is Better If:
- You want passive income with minimal involvement
- You have limited capital for initial setup
- You prefer stable, predictable cash flows
- You are investing in markets with rent control
- You do not want to learn a new business model
Coliving Is Better If:
- You want to maximize revenue per square foot
- You enjoy hospitality and community building
- You have the capital for furnishing and technology
- You are investing in markets with strong young professional demand
- You are willing to invest time in operations or hire skilled managers
The Verdict
Coliving is not "better" than traditional renting. It is a different business. Traditional renting is a real estate investment. Coliving is a real estate-enabled hospitality business. The returns are higher, but so are the demands. The most successful coliving investors understand this distinction and choose their model accordingly.
For investors who want the best of both worlds, starting with a single coliving property while maintaining a traditional portfolio provides diversification and a learning opportunity without overcommitting to an unfamiliar model.
Free Newsletter
Join 36,000+ coliving professionals
Weekly insights on operations, marketing, and growth, delivered to your inbox.
Subscribe Free →Coliving vs traditional rental: the IRR decomposition no one publishes
The most useful way to compare coliving against a traditional buy-to-let is to decompose the 5-year levered IRR into its four sources: cash yield, NOI growth, multiple expansion, and leverage. EC operator dataset across UK, US and EU markets shows a consistent pattern: traditional rental gets most of its return from cash yield and modest leverage, while coliving gets the majority from NOI growth and multiple expansion. That is why they appeal to different investor profiles.
| IRR component | Traditional rental (5-yr) | Coliving (5-yr stabilised) |
|---|---|---|
| Cash yield | 55-65% of IRR | 20-30% of IRR |
| NOI growth | 15-22% of IRR | 32-44% of IRR |
| Multiple expansion | 5-12% of IRR | 18-30% of IRR |
| Leverage contribution | 10-18% of IRR | 8-16% of IRR |
| Total levered IRR range | 9-13% | 15-22% |
The operating intensity premium
Coliving's higher return profile is not a free lunch. EC operator interviews consistently flag operating intensity as the cost of admission. A traditional 6-unit rental block can be managed by a part-time letting agent at 8 to 12 percent of GOI. A 60-bed coliving asset requires 1.4 to 2.2 FTE staff per 100 beds, a 24/7 community manager rotation, an F&B function (if applicable), a tech stack (PMS, CRM, access control), and an active marketing engine. Total opex ratio runs 38 to 52 percent of GOI versus 18 to 28 percent for traditional residential rental.
The compensating advantage is RevPAB. Coliving extracts 1.7 to 2.4x the revenue per square metre of a traditional rental in the same building shell. The investor question is whether the doubled revenue justifies the doubled operating complexity, and the answer depends almost entirely on management capability.
Tax efficiency: how the structures compare
- Depreciation and capital allowances: coliving claims significantly more, because plant, machinery, FF&E, and amenity spaces qualify at higher rates than residential dwellings. EC quantity surveyor interviews suggest 15 to 22 percent of new-build coliving capex qualifies for UK plant and machinery allowances vs 6 to 10 percent for traditional BTL.
- US Section 179 and bonus depreciation: coliving operators can expense more FF&E in year one, accelerating after-tax cash flow versus a traditional rental investor relying on 27.5-year residential depreciation schedules. A cost-segregation study typically front-loads 18 to 32 percent of depreciation into the first 5 years.
- 1031 exchanges: both products qualify in the US, but exit liquidity is thinner for coliving, which can constrain timing.
- VAT and GST: coliving sits in a more complex VAT/GST environment than traditional residential rental, particularly in the EU, UK, and India. Operators that treat the asset as serviced accommodation can recover input VAT but charge output VAT, with a net positive in development phase and a net negative on operating revenue.
Exit liquidity: what actually clears at year 5
The risk most novice coliving sponsors underestimate is exit. Traditional rental assets sell to a deep pool: BTL landlords, family offices, BTR portfolios. Cap rates compress and expand in tight bands (50 to 100 bps over a cycle). Coliving exit is concentrated in a small number of institutional buyers (BTR funds, REIT platforms, specialist coliving funds) that demand specific criteria: 80-plus beds, EPC B or better, 3-year audited financials, brand or operator continuity. Below those thresholds, the exit buyer pool collapses and discounts of 12 to 25 percent versus expected cap rate are common.
The DSCR and debt sizing comparison
| Item | Traditional BTL | Coliving |
|---|---|---|
| Typical LTC | 65-75% | 55-65% |
| DSCR covenant | 1.20-1.35 | 1.30-1.55 |
| ICR covenant | 1.45-1.75 | 1.75-2.15 |
| Interest reserve | 0-3 months | 6-12 months |
| Lender pool | Deep, commoditised | Shallow, specialist |
Which investor profile each product fits
- Traditional rental fits: investors prioritising predictable cash yield, low operating complexity, deep exit liquidity, and willingness to accept moderate IRR ceilings. Family offices, pension funds, and individual landlords seeking 9 to 13 percent levered IRR.
- Coliving fits: investors comfortable with operating complexity, seeking higher IRR (15 to 22 percent), willing to accept thinner exit liquidity and longer ramp periods. Specialist real-estate funds, growth-stage operators with brand ambitions, and forward-funding institutional buyers.
The risk-adjusted return question most novice investors skip
Headline IRR comparisons are misleading because they ignore operational risk dispersion. EC operator dataset shows traditional rental IRR outcomes cluster within 200 to 350 bps of the mean across stabilised assets, while coliving IRR outcomes disperse 600 to 1,100 bps around the mean. That means a 17 percent expected coliving IRR can realistically produce outcomes between 11 and 23 percent, while a 12 percent expected traditional rental IRR produces 10 to 14 percent. Risk-adjusted, the gap narrows materially. Sponsors that present coliving without an explicit dispersion analysis are routinely flagged in IC committees that have learned to ask for it.
The blended portfolio thesis sophisticated investors test
EC investor interviews increasingly surface a blended thesis: 60 to 75 percent of capital in traditional rental for cash yield and liquidity, 25 to 40 percent in coliving for IRR and growth. This barbell construction lets a portfolio show 12 to 16 percent blended IRR with a stable cash yield floor, which is the profile institutional LP committees prefer over a pure-play coliving exposure. Sponsors raising capital should test whether positioning their fund within a blended thesis (rather than as a coliving-only vehicle) widens the addressable LP pool by 30 to 60 percent.
Written by
Mayank Pokharna
Mayank Pokharna is the founder of Everything Coliving. 11+ years in coliving as an operator, PMS builder (JumboTiger, SimplyGuest), and advisor to 60+ operators across 14+ countries. Listed as a coliving expert on co-liv.org, featured in Forbes India, BBC Punjabi, Financial Express, and Economic Times, and published on the economics of shared living.
Explore Related Topics
Free Tools
Further Reading
Related Articles

Coliving Insurance: A Comprehensive Guide for Operators
Coliving properties face unique insurance challenges. Learn about the policies you need, common coverage gaps, and how to protect your business.

Coliving in Asia-Pacific: Market Overview and Opportunities
Asia-Pacific is the fastest-growing coliving market globally. Explore key markets, consumer trends, and investment opportunities across the region.

Coliving Pricing Strategies: How to Maximize Revenue Per Bed
Learn dynamic pricing, tiered room strategies, and ancillary revenue tactics that top coliving operators use to maximize their revenue per bed.

Coliving Lease Agreements: What to Include and What to Avoid
Your lease agreement sets the legal foundation for your coliving business. Learn the essential clauses, common pitfalls, and best practices for coliving-specific leases.
Coliving Insurance: What Coverage Do You Actually Need?
Navigating insurance for coliving properties is complex. This guide covers the essential policies, common gaps, cost benchmarks, and how to avoid expensive mistakes.