
Coliving Unit Economics Cheat Sheet: CPOR, ADR, RevPAR Explained

Reviewed for accuracy
Mayank Pokharna, founder of Everything Coliving, reviewed this article. Basis of expertise: 11+ years operating and researching coliving; advisory work with 60+ operators across 14+ countries; primary source data from the EC operator dataset (500+ surveys). Financial and regulatory figures cross-referenced with JLL, CBRE, Cushman & Wakefield, and Knight Frank published research.
Recommended Tools
Free interactive tools related to this article.
ROI Calculator
Estimate potential returns and payback periods for coliving.
Try it free →Operating Budget Template
Build a comprehensive operating budget for your property.
Try it free →Pricing Optimizer
Find the optimal pricing strategy for your coliving rooms.
Try it free →Vacancy Cost Calculator
Quantify the true cost of empty rooms in your property.
Try it free →The Metrics That Matter in Coliving
Understanding your unit economics is the difference between a thriving coliving business and one that slowly bleeds cash. These are the metrics that investors ask about, lenders evaluate, and operators use to make daily decisions.
Revenue Metrics
RevPAR (Revenue per Available Room/Month)
Formula: Total Monthly Revenue / Total Available Rooms
This is the single most important revenue metric because it combines both pricing and occupancy into one number. A high price means nothing with low occupancy, and full occupancy means nothing with low prices. RevPAR captures both.
Industry benchmark: €650-850/month globally. See our benchmarks dashboard for regional breakdowns.
ADR (Average Daily Rate)
Formula: Total Revenue / Total Occupied Room-Nights
Most useful for operators with significant short-stay business. For pure long-stay coliving, monthly RevPAR is more relevant.
Cost Metrics
CPOR (Cost per Occupied Room/Month)
Formula: Total Operating Costs / Total Occupied Rooms
Your CPOR tells you the true cost of housing each resident. The gap between RevPAR and CPOR is your gross margin per room. Industry benchmark: €350-550/month.
Profitability Metrics
NOI Margin
Formula: (Total Revenue - Total Operating Expenses) / Total Revenue × 100
The most commonly quoted profitability metric. Industry benchmark: 18-28%. Below 15% signals problems. Above 25% is strong performance.
EBITDA Margin
Formula: EBITDA / Total Revenue × 100
Investors prefer EBITDA because it strips out financing and depreciation, making it easier to compare across operators. Benchmark: 15-25%.
Use our break-even calculator to model your unit economics at different occupancy levels.
Frequently Asked Questions
Which metric should I optimize first?
Start with occupancy (get above 85%), then optimize pricing (maximize RevPAR), then reduce costs (lower CPOR). Most operators make the mistake of cutting costs first, but you can't cost-cut your way to profitability if occupancy is below break-even.
Per-bed P&L: the canonical structure
Coliving operators track P&L on a per-bed basis to enable property-by-property comparison and benchmark across cities. The canonical structure:
Revenue (per bed/month):
- Base rent: 80-95% of total revenue
- Ancillary services (cleaning premium, parking, pets): 5-15%
- One-time fees (move-in, late fees): 1-5%
Operating expenses (per bed/month):
- Property rent or debt service: 35-50% of revenue
- Utilities + supplies: 8-12%
- Cleaning + maintenance: 6-10%
- Community manager + ops payroll: 8-14%
- Insurance + property tax: 4-8%
- Marketing + sales: 4-8%
- Software + tooling: 1-3%
NOI margin (Western markets): 25-35% at stabilization, with permissive markets (Lisbon, Madrid, Austin) at the high end and compliance-heavy markets (London, NYC, Berlin) at the low end.
Sensitivity to occupancy
Coliving has high fixed costs (community manager salary, base utilities, debt service) so the P&L is heavily occupancy-sensitive. A property with 70% breakeven and 90% stabilized occupancy has a 20-point margin of safety. A property with 78% breakeven and 88% stabilized has only 10 points, far less resilient to demand softening or seasonal dips.
Free Newsletter
Join 36,000+ coliving professionals
Weekly insights on operations, marketing, and growth, delivered to your inbox.
Subscribe Free →The three numbers operators track weekly
RevPAB (revenue ÷ available bed-nights), captures pricing and occupancy in one metric. ADR (revenue ÷ occupied bed-nights), captures pricing alone. ALOS (occupied bed-nights ÷ unique stays), captures retention. RevPAB is the headline; ADR and ALOS explain the why.
Common mistakes operators make on unit economics
- Under-budgeting CAC. Acquisition costs typically run 4-8% of revenue at stabilization, not 2%.
- Excluding management fees from NOI for owner-operated properties, distorts comparison vs third-party-managed comparables.
- Not separating gross-rent RevPAB from total-revenue RevPAB, leading to inconsistent KPI reporting across portfolios.
- Including security deposits in revenue. Deposits are balance-sheet items, not recognized revenue.
Related resources
- For the full RevPAB methodology, see RevPAB (glossary entry).
- For breakeven calculation, see Breakeven Occupancy.
- For the underwriting workflow, see How to Underwrite a Coliving Deal.
- For modeling RevPAB in Excel, see How to Model RevPAB in Excel.
The benchmark table operators actually need
Stabilized unit economics across the major coliving markets. These are operator-grade ranges drawn from EC dataset, Knight Frank European Coliving Index 2024, JLL US Living Sectors, Anarock India Coliving Report 2025. Each market shows RevPAB / ADR / Stabilized Occupancy / NOI Margin at stabilization:
- London: £950-1,300 / £35-48 / 91-94% / 22-28%
- New York: $1,100-1,500 / $40-55 / 88-93% / 20-26%
- Berlin: €650-820 / €24-31 / 89-93% / 22-27%
- Madrid: €520-680 / €19-25 / 89-94% / 26-32%
- Lisbon: €550-720 / €20-27 / 88-93% / 28-35%
- Austin: $650-900 / $24-33 / 90-95% / 32-38%
- Mexico City: $550-750 / $20-27 / 88-92% / 30-38%
- Bangalore: ₹15,000-28,000 / ₹600-1,050 / 91-96% / 28-36%
- Singapore: SGD 1,800-2,800 / SGD 65-100 / 94-97% / 18-24%
- Dubai: AED 4,500-7,200 / AED 165-265 / 88-93% / 22-28%
The pattern: permissive-regulation markets (Lisbon, Austin, Mexico City, Bangalore) deliver higher NOI margins than compliance-heavy markets (London, NYC, Berlin, Singapore). The 5-12pp NOI spread is the structural reason capital is increasingly flowing toward permissive markets.
The CPOR drill-down operators rarely do
Generic CPOR (Cost per Occupied Room/month) reporting hides the operational levers. The five-component CPOR breakdown that actually drives operating decisions:
- Property cost component (35-50% of CPOR). Master rent or debt service. Operators have little weekly control here, set at acquisition / lease signing.
- Variable utilities + supplies (12-18% of CPOR). Electricity, water, gas, internet, cleaning consumables. Smart-thermostat + LED + low-flow fixtures can reduce this 15-25%.
- Payroll component (15-22% of CPOR). Community manager + ops staff allocated per occupied bed. Operators that consistently fill below 90% occupancy see this component balloon (fixed payroll, declining denominator).
- Maintenance + turnover (8-14% of CPOR). Reactive repairs + cleaning + room refresh between tenants. Operators with ALOS < 5 months see this component as the largest controllable cost.
- Marketing + sales (6-12% of CPOR). Paid acquisition + organic content investment + referral programs. Operators with strong brand pull bring this to 4-7%; weak brand operators end up at 10-14% even at scale.
Tracking CPOR by component monthly is how operators identify which lever to pull. A property running 5pp above benchmark CPOR usually has one component dramatically out of line, diagnose first, then act.
Sensitivity to occupancy: where breakeven actually is
A typical coliving NOI sensitivity to occupancy (50-bed property, mid-market Western European positioning):
- At 95% occupancy: 30% NOI margin
- At 90% occupancy: 27% NOI margin (the assumed base case)
- At 85% occupancy: 23% NOI margin
- At 80% occupancy: 18% NOI margin
- At 75% occupancy: 12% NOI margin
- At 72% occupancy: ~8% NOI margin (breakeven for typical debt-financed deal)
The slope between 90% and 75% occupancy is the most important number in coliving deal underwriting. Properties with steep slopes (every percentage point of occupancy is 1.5-2pp of NOI) are fragile in downturns. Properties with shallow slopes (every percentage point is 0.8-1.2pp of NOI) are resilient.
What determines slope steepness: (a) fixed-cost share, high fixed costs (debt service, base salaries) create steep slopes; (b) variable revenue share, properties with significant ancillary revenue have slightly steeper slopes because ancillary scales with occupancy; (c) operator overhead allocation, properties with heavy corporate allocation see steeper effective slopes.
Capital efficiency metrics most operators ignore
NOI margin and CPOR dominate operator dashboards but capital efficiency metrics determine investor returns. The four most important:
Yield on Cost (YOC)
Stabilized NOI ÷ Total Invested Capital (purchase + capex + lease deposit). YOC of 7-9% is healthy for development; 6-8% for value-add acquisitions; 5-6.5% for stabilized acquisitions. Tracks the all-in return on capital deployed, including hidden capex that NOI margin alone misses.
Capital Velocity
Revenue generated per dollar of capital deployed annually. Asset-light operators (master lease) achieve 4-8x capital velocity (revenue:capital); asset-heavy operators 0.4-0.8x. The structural reason asset-light models attract growth equity is purely this: same capital generates 8-12x the revenue.
Bed-Equivalent Acquisition Cost
All-in capital per stabilized bed at acquisition. London £18,000-28,000 per bed in conversions; €8,000-15,000 in Spain/Portugal; $5,000-10,000 in US Sunbelt; ₹150,000-400,000 in India. Geographic dispersion of bed-cost is structurally tied to land cost and regulatory complexity.
Stabilization Time
Months from operations launch to >85% sustained occupancy. Mature operators 6-12 months; new operators 12-18 months; new operators in new markets 18-24 months. Stabilization time is the most operationally consequential variable in coliving deal underwriting, a 6-month delay typically costs 200-400bps of project IRR.
The four-number summary for any coliving deal
Investors evaluating coliving deals reduce the complexity to four numbers. Operators presenting deals should lead with these:
- Stabilized NOI margin, the operating performance number.
- Yield on Cost, the capital efficiency number.
- Stabilization time, the execution-risk number.
- Breakeven occupancy, the downside-resilience number.
A "good" coliving deal in 2026: NOI margin 22-30%, YOC 7-9%, stabilization 9-15 months, breakeven 72-78%. Deals materially weaker on any one metric warrant explicit explanation. Decks that lead with these four numbers signal operator sophistication; decks that lead with TAM/SAM or growth slides signal the opposite.
Common unit-economics mistakes in operator decks
- Reporting "average" RevPAB without distribution. A €700 average across properties ranging €500-900 is materially different from €700 across €680-720. Always show distribution.
- Excluding corporate overhead from NOI. Property-level NOI flatters the picture; operator-level NOI is what investors care about.
- Confusing target with stabilized. "We're targeting 92% occupancy" is irrelevant. "We're operating at 89% in months 12-24" is meaningful.
- Annualizing seasonal data. European summer months are typically 5-12pp below year-average. Pitch decks that show only summer data inflate performance.
- Ignoring deposit treatment. Security deposits are balance-sheet items, not revenue. Operators including them in revenue inflate top-line 8-12%, and get caught in diligence.
- Cherry-picking time windows. A 24-month track record showing 12 months of strong performance and 12 months of weak performance averaged across the period misrepresents trend. Show the time series.
Written by
Mayank Pokharna
Mayank Pokharna is the founder of Everything Coliving. 11+ years in coliving as an operator, PMS builder (JumboTiger, SimplyGuest), and advisor to 60+ operators across 14+ countries. Listed as a coliving expert on co-liv.org, featured in Forbes India, BBC Punjabi, Financial Express, and Economic Times, and published on the economics of shared living.
Explore Related Topics
Free Tools
Further Reading
Related Articles

How to Raise Rent Without Losing Residents
A strategic guide for coliving operators on when and how to raise rent, including communication templates, justification strategies, and handling pushback.

Coliving Insurance: What Coverage Do You Actually Need?
Navigating insurance for coliving properties is complex. This guide covers the essential policies, common gaps, cost benchmarks, and how to avoid expensive mistakes.
Coliving Insurance: A Comprehensive Guide for Operators
Coliving properties face unique insurance challenges. Learn about the policies you need, common coverage gaps, and how to protect your business.
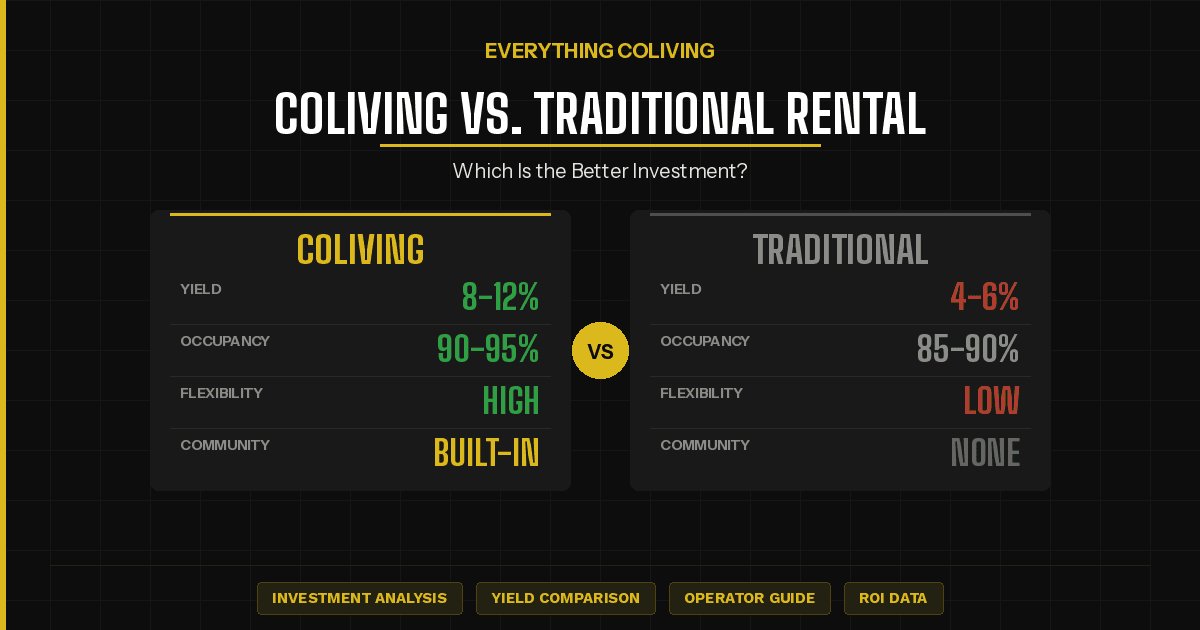
Coliving vs. Traditional Rental: Which Is the Better Investment?
Compare the financial returns, risks, and operational demands of coliving investments against traditional buy-to-let properties.

Coliving Staff Compensation Benchmarks by Region
Regional salary benchmarks for every coliving role including community managers, operations managers, cleaning staff, and maintenance, with compensation structures and benefits.