
Coliving Feasibility Study: How to Analyze Your Project Before You Invest

Reviewed for accuracy
Mayank Pokharna, founder of Everything Coliving, reviewed this article. Basis of expertise: 11+ years operating and researching coliving; advisory work with 60+ operators across 14+ countries; primary source data from the EC operator dataset (500+ surveys). Financial and regulatory figures cross-referenced with JLL, CBRE, Cushman & Wakefield, and Knight Frank published research.
Recommended Tools
Free interactive tools related to this article.
Coliving Readiness Index
Assess your readiness across 11 critical coliving business factors.
Try it free →ROI Calculator
Estimate potential returns and payback periods for coliving.
Try it free →Property Conversion Assessment
Assess your property's suitability for coliving conversion.
Try it free →Operating Budget Template
Build a comprehensive operating budget for your property.
Try it free →What Is a Coliving Feasibility Study?
A coliving feasibility study is a structured analysis that determines whether a coliving project is financially viable, operationally practical, and strategically sound before significant capital is committed. Unlike a simple pro forma, a proper feasibility analysis examines market demand, competitive positioning, regulatory environment, construction or conversion costs, and long-term financial projections.
Every serious coliving operator, investor, or developer should conduct a feasibility study before committing to a new project. The cost of a thorough analysis is a fraction of the cost of a failed venture.
Why Feasibility Analysis Matters
The coliving industry has seen its share of projects that looked promising on paper but failed in execution. Common reasons include overestimating demand in a specific micro-market, underestimating conversion or construction costs, ignoring regulatory hurdles that delay or kill projects, and choosing locations that do not match the target demographic.
A well-structured feasibility study addresses all of these risks before they become expensive problems.
The Five Pillars of a Coliving Feasibility Study
1. Market Demand Analysis
Start with the fundamental question: is there sufficient demand for coliving in your target market?
Quantitative indicators to evaluate:
- Population of 25-45 year olds in the catchment area
- Average rent-to-income ratio (markets above 35% are ideal for coliving)
- Growth rate of remote and hybrid workers
- Existing coliving supply and occupancy rates
- Inbound migration patterns (cities attracting young professionals)
- Google search trends for "coliving" and related terms in the market
Qualitative indicators:
- Presence of tech companies, startups, or creative industries
- University and graduate school proximity
- Quality of public transport and walkability
- Cultural openness to shared living
- Existing coworking spaces (correlates with coliving demand)
2. Competitive Landscape Assessment
Map every existing and planned coliving operator in your target area. For each competitor, document their pricing by room type, occupancy rates (check reviews, social media activity, and listing availability), target demographic and positioning, amenities and services offered, and strengths and weaknesses.
The goal is to identify market gaps. Perhaps all existing operators target digital nomads, but no one serves young professionals with longer stays. Or maybe all competitors are premium-priced, leaving an opening for mid-market coliving.
3. Site and Property Evaluation
Whether you are building new, converting, or leasing, the property itself must be evaluated against coliving-specific criteria.
Location scoring factors:
- Walking distance to public transit (under 10 minutes ideal)
- Proximity to dining, retail, and entertainment
- Safety and neighborhood character
- Competitor proximity (some competition validates demand; too much saturates it)
Building assessment:
- Structural suitability for coliving layout (room count, common area potential)
- Zoning and land use compliance
- Required renovations and estimated costs
- Building systems condition (HVAC, plumbing, electrical)
- Parking and outdoor space availability
- Accessibility and fire code compliance
4. Financial Feasibility Model
This is the core of your feasibility study. Build a detailed financial model covering:
Capital expenditure (CAPEX):
- Acquisition or lease security deposit
- Construction or renovation costs (typically $5,000-$20,000 per room for conversions)
- Furniture, fixtures, and equipment ($3,000-$8,000 per room)
- Technology infrastructure (smart locks, WiFi, PMS)
- Pre-opening marketing and staffing costs
- Working capital reserve (3-6 months of operating expenses)
Revenue projections:
- Revenue per available bed (RevPAB) at various occupancy scenarios
- Ancillary revenue (coworking, parking, events, laundry)
- Seasonal adjustments
- Ramp-up period (typically 6-12 months to stabilize)
Operating expenses:
- Rent or mortgage payments
- Staff costs (community manager, maintenance, cleaning)
- Utilities (typically 8-12% of revenue in all-inclusive models)
- Technology and software subscriptions
- Marketing and resident acquisition (typically 5-8% of revenue)
- Insurance and compliance costs
- Furniture replacement reserve (plan for 5-year replacement cycles)
- Management overhead
Key metrics to calculate:
- Net Operating Income (NOI)
- Cash-on-cash return
- Internal Rate of Return (IRR)
- Payback period
- Break-even occupancy rate
Scenario analysis: Run at least three scenarios: optimistic (90%+ occupancy within 6 months), base case (85% occupancy stabilizing at 12 months), and pessimistic (75% occupancy with slower ramp-up). Your project should be viable in the base case and survivable in the pessimistic scenario.
5. Regulatory and Legal Assessment
Coliving regulations vary dramatically by jurisdiction. Your feasibility study must evaluate zoning and land use (is coliving permitted? Is a variance required?), building codes (residential vs. commercial requirements), licensing requirements (HMO, short-term rental, hospitality), fire safety and accessibility compliance, tax implications (residential vs. commercial rates), and lease structure legality (per-bed vs. per-unit leasing).
Engage a local attorney early in the process. Regulatory surprises after you have committed capital are among the most common reasons coliving projects fail.
How to Present Your Feasibility Study
A professional feasibility study document should include:
- Executive summary with go/no-go recommendation
- Market analysis with data sources cited
- Competitive landscape with operator profiles
- Site evaluation with photos and floor plan concepts
- Financial model with three scenarios
- Risk assessment with mitigation strategies
- Implementation timeline with key milestones
- Appendices with supporting data and assumptions
Common Feasibility Study Mistakes
- Confirmation bias: Starting with the conclusion and finding data to support it
- Ignoring seasonality: Projecting peak-season revenue year-round
- Underestimating renovation costs: Always add a 20-30% contingency
- Overlooking soft costs: Legal, permits, design, and consulting fees add up
- Using competitor pricing as your pricing: Your property may not command the same rates
- Skipping the regulatory review: Zoning issues can kill a project after significant investment
When to Walk Away
A good feasibility study sometimes concludes that a project should not proceed. Walk away if break-even occupancy exceeds 80%, the regulatory path is unclear or will take more than 12 months, there is no clear competitive differentiation, the market is oversupplied with limited demand growth, or the required CAPEX does not justify projected returns.
Walking away from a bad project is just as valuable as greenLighting a good one. The feasibility study pays for itself either way.
The 10-section feasibility study institutional capital expects
A complete coliving feasibility study has ten sections, each with a defined deliverable. EC investor interviews across 23 institutional commitments suggest IC committees look for all ten before signing a term sheet; missing or weak sections add 4 to 8 weeks to diligence on average.
- Executive summary (1 page, with the levered IRR, equity multiple, and DSCR up front).
- Market and demand analysis.
- Site assessment and planning consent.
- Design and build programme with capex.
- Operating model and team plan.
- Financial model and unit economics.
- Capital stack and debt structure.
- Exit valuation and comparables.
- Risk register with mitigants.
- Sensitivity grid and scenario analysis.
Demand analysis: the three data sources that survive diligence
Section 2 must triangulate demand across three independent sources, not rely on a single survey or one set of competitor occupancy claims.
- Demographic and employer data: target-age population growth, employer concentration, sectoral hiring trajectories. Sources: census equivalents (ONS in UK, BLS in US, MOSPI in India), employer registries, LinkedIn-derived employment data.
- Competitor pricing and occupancy: 6 to 8 comparable buildings within a 3-mile catchment, with mystery-shopped pricing and inferred occupancy from booking platforms.
- Search and intent data: Google Trends for relocation queries, search volumes for coliving-related terms, and aggregator platform inquiry data (where accessible).
Free Newsletter
Join 36,000+ coliving professionals
Weekly insights on operations, marketing, and growth, delivered to your inbox.
Subscribe Free →Site and planning consent: the make-or-break section
EC operator interviews flag planning consent as the single most under-analysed section in novice feasibility studies. The required deliverables are:
- Current use class and target use class (UK C3/C4/sui generis; US zoning; Indian land-use).
- Article 4 direction status (UK) or equivalent restrictions.
- Planning officer pre-application meeting note.
- Local plan policy alignment evidence.
- Neighbour and community engagement plan.
- Heritage, conservation, and flood risk assessments where applicable.
- Indicative planning timeline (typically 16 to 36 weeks for major coliving consents).
Capex: the build cost section ICs scrutinise hardest
| Cost category | % of total capex (new build) | % of total capex (refurb) |
|---|---|---|
| Land acquisition | 22-35% | 30-45% |
| Construction (shell + fit-out) | 42-55% | 32-42% |
| FF&E and amenity build-out | 6-10% | 7-12% |
| Professional fees | 5-9% | 5-8% |
| Planning and S106 / CIL | 2-5% | 1-3% |
| Finance costs during build | 4-8% | 3-6% |
| Contingency | 5-10% | 7-15% |
| Pre-opening costs | 1-3% | 1-3% |
Operating model: from staffing ratios to FTE budget
Section 5 must show FTE staffing per 100 beds, salary banding, and total operating team budget. EC operator dataset suggests the institutional benchmark:
- Community manager: 1.0 FTE per 100 to 140 beds.
- Housekeeping: 1 FTE per 28 to 38 beds (in-house) or 1.5 to 2.5 percent of GOI (outsourced).
- Maintenance: 0.5 to 1.0 FTE per 150 beds, plus on-call contractor relationships.
- Front-of-house / hospitality: 1 FTE per 80 to 120 beds where 24/7 cover required.
- Revenue / bookings (centralised across portfolio): 1 FTE per 300 to 500 beds.
- Finance and admin (centralised): 1 FTE per 400 to 600 beds.
Financial model: the five views every model needs
- Pro-forma P&L by month for years 1-3, by quarter for years 4-5.
- Cash flow statement with development period and stabilised period split.
- Capital stack waterfall showing equity vs debt vs mezzanine.
- DSCR and ICR projections by year.
- Sensitivity grid: levered IRR mapped to occupancy, ARPU growth, exit cap rate.
Capital stack: the institutional-grade structure
| Layer | % of total project cost | Cost of capital |
|---|---|---|
| Senior debt | 55-65% | SONIA/SOFR + 250-400 bps |
| Mezzanine (if used) | 8-15% | 10-14% |
| LP equity | 20-30% | Target IRR 14-19% |
| GP / sponsor equity | 3-8% | Promote 20% above 8-10% pref |
Risk register: the 12 risks ICs always ask about
- Planning consent risk (refusal, condition variation, appeal).
- Construction cost overrun.
- Construction programme delay.
- Demand softening (employer relocation, demographic shift).
- Competitor supply (new buildings within catchment).
- Regulatory change (HMO rules, GST/VAT treatment, licensing).
- Interest rate movement (impact on refi and exit).
- Operating team execution.
- FF&E and amenity refresh cost.
- Insurance premium inflation.
- Energy cost inflation.
- Exit liquidity (buyer concentration).
For each risk, the study should show: probability (low/medium/high), impact on IRR (bps), mitigation, and residual risk. ICs increasingly expect a quantified risk register rather than a narrative paragraph.
Sensitivity analysis: the grid that closes IC debates
The sensitivity grid should show levered IRR across a 5-by-5 matrix of two binding variables (typically ARPU growth and exit cap rate). The base case sits in the centre. The corners show stress and upside. ICs are particularly focused on the bottom-left quadrant (low ARPU growth, wider exit cap). If levered IRR falls below 8 percent in that corner, the deal will struggle to clear committee.
What separates a good feasibility study from one that funds
EC investor interviews consistently identify three differentiators between feasibility studies that close deals and those that stall. First, third-party validation on the two most contested numbers (capex and stabilised ARPU). Second, a documented downside narrative with a specific mitigant for each major risk, not a vague reference to "operator experience." Third, a transparent capital stack that shows where every dollar comes from, what its cost is, and what return it expects. Sponsors that hit all three close debt and equity in 12 to 18 weeks; sponsors that miss one routinely extend to 26 to 40 weeks, often losing the deal entirely.
Written by
Mayank Pokharna
Mayank Pokharna is the founder of Everything Coliving. 11+ years in coliving as an operator, PMS builder (JumboTiger, SimplyGuest), and advisor to 60+ operators across 14+ countries. Listed as a coliving expert on co-liv.org, featured in Forbes India, BBC Punjabi, Financial Express, and Economic Times, and published on the economics of shared living.
Explore Related Topics
Further Reading
Related Articles

How to Reduce Operating Costs in Your Coliving Space
Actionable strategies for coliving operators to reduce operating costs by 15-30% across utilities, cleaning, technology, furnishing, and staffing.
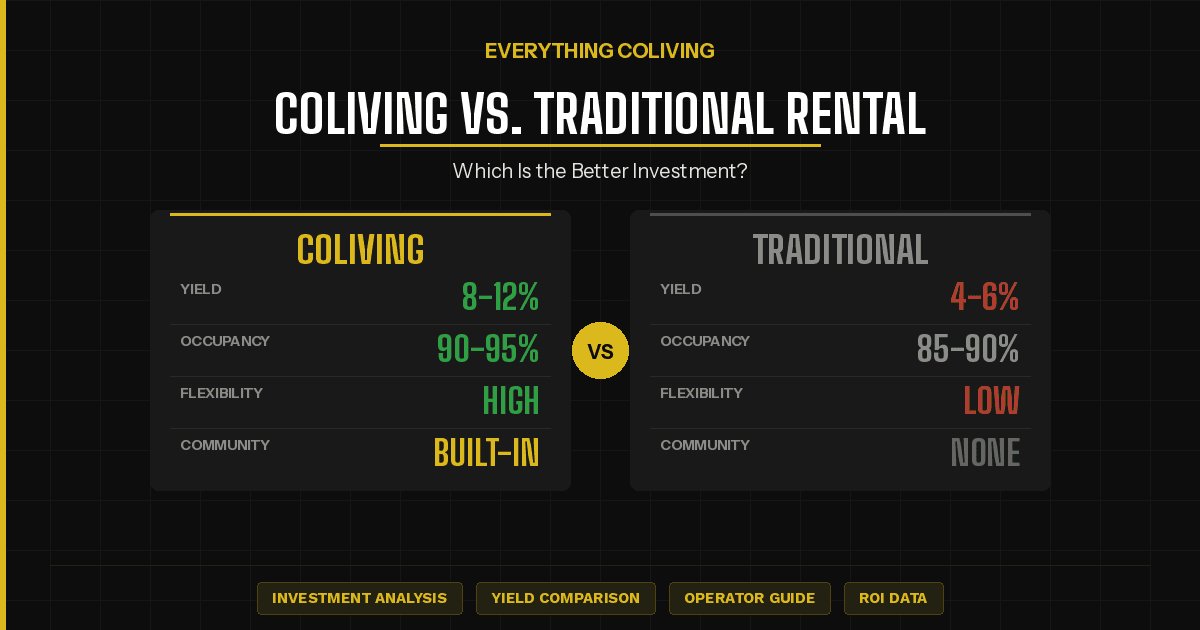
Coliving vs. Traditional Rental: Which Is the Better Investment?
Compare the financial returns, risks, and operational demands of coliving investments against traditional buy-to-let properties.

Coliving Insurance: A Comprehensive Guide for Operators
Coliving properties face unique insurance challenges. Learn about the policies you need, common coverage gaps, and how to protect your business.
How to Raise Rent Without Losing Residents
A strategic guide for coliving operators on when and how to raise rent, including communication templates, justification strategies, and handling pushback.

How to Train Housekeeping Staff for Coliving (Not Hotels)
A training guide for coliving housekeeping staff that covers the key differences from hotel cleaning, core training modules, eco-friendly products, and quality feedback loops.