
Coliving vs Build to Rent (BTR): Which Model Delivers Better Returns?

Reviewed for accuracy
Mayank Pokharna, founder of Everything Coliving, reviewed this article. Basis of expertise: 11+ years operating and researching coliving; advisory work with 60+ operators across 14+ countries; primary source data from the EC operator dataset (500+ surveys). Financial and regulatory figures cross-referenced with JLL, CBRE, Cushman & Wakefield, and Knight Frank published research.
Recommended Tools
Free interactive tools related to this article.
ROI Calculator
Estimate potential returns and payback periods for coliving.
Try it free →Operating Budget Template
Build a comprehensive operating budget for your property.
Try it free →Pricing Optimizer
Find the optimal pricing strategy for your coliving rooms.
Try it free →Vacancy Cost Calculator
Quantify the true cost of empty rooms in your property.
Try it free →Coliving vs Build to Rent: Two Models Reshaping Residential Real Estate
Build to rent (BTR) and coliving represent two of the fastest-growing segments in residential real estate. Both emerged as responses to the housing affordability crisis, both target renters who prioritize flexibility over ownership, and both have attracted significant institutional investment. But they serve different needs, require different operational approaches, and deliver different risk-return profiles.
Defining the Models
Build to Rent (BTR)
Purpose-built residential developments designed for long-term rental rather than sale. Units are typically self-contained apartments with full kitchens and bathrooms, managed by a single institutional landlord. Amenities like gyms, lounges, and concierge services are standard in newer developments.
Coliving
Managed shared living spaces where residents have private bedrooms (often with ensuite bathrooms) and share communal areas like kitchens, living rooms, and coworking spaces. All-inclusive pricing covers rent, utilities, WiFi, furnishings, and often community programming.
Financial Comparison
Development Costs
BTR development costs are typically $150,000-$300,000+ per unit depending on market, quality tier, and construction method. Projects are large-scale (typically 100+ units) and capital-intensive.
Coliving development costs are significantly lower on a per-bed basis. Conversions of existing buildings run $5,000-$20,000 per bed, while purpose-built coliving typically costs $50,000-$120,000 per bed. Projects can be viable at smaller scale (20-50 beds).
Revenue Per Square Meter
This is where coliving's financial advantage is most apparent. By sharing kitchens, living rooms, and other amenities, coliving maximizes the number of revenue-generating bedrooms per square meter.
A typical BTR building generates $25-$45 per square meter per month in rental income. A well-designed coliving building generates $40-$75 per square meter per month. The 50-80% revenue premium reflects the efficient use of shared spaces and the all-inclusive pricing model.
Yields
BTR net yields in major markets typically range from 3.5-5.5%. Yields are compressed in prime locations where land costs are highest. The stability and institutional acceptance of BTR has driven yield compression over the past decade.
Coliving net yields typically range from 5-9%, reflecting the management premium and operational complexity. Higher yields also reflect the emerging nature of the asset class and the perception of higher risk.
Operating Margins
BTR operating margins are typically 60-75% of gross revenue. Lower management intensity and fewer services keep costs contained.
Coliving operating margins are typically 35-50% of gross revenue. Higher costs reflect community management, furnishing replacement, technology platforms, community programming, and all-inclusive utilities.
Despite lower margins, coliving often generates higher absolute NOI per square meter due to the revenue premium.
Operational Comparison
Management Intensity
BTR is operationally simpler. Residents manage their own households. The landlord provides the building, amenities, and basic services (maintenance, common area cleaning). Staffing requirements are minimal: a building manager and maintenance team.
Coliving is operationally intensive. Community managers facilitate events, manage resident relationships, coordinate cleaning of shared spaces, and maintain a hospitality-grade environment. Technology requirements are higher. Staff-to-resident ratios are typically 1:30-50 for coliving vs. 1:100+ for BTR.
Tenant Profile and Turnover
BTR attracts a broad demographic: young professionals, couples, families, and downsizers. Average tenancy is 2-3 years. Turnover costs are moderate ($500-$1,500 per unit for cleaning and minor repairs).
Coliving primarily attracts single professionals aged 25-40. Average tenancy is shorter (6-12 months), but some operators achieve 18+ months through strong community. Turnover costs are higher ($300-$800 per room for cleaning, linens, and minor repairs) but more frequent.
Technology Requirements
BTR technology is relatively straightforward: property management software, building access systems, maintenance request platforms, and smart home features in higher-end developments.
Coliving requires a more sophisticated tech stack: per-bed billing, dynamic pricing, community platforms, event management, shared resource scheduling, and often custom-built community apps.
Free Newsletter
Join 36,000+ coliving professionals
Weekly insights on operations, marketing, and growth, delivered to your inbox.
Subscribe Free →Market Dynamics
Demand Drivers
BTR demand is driven by the general trend away from homeownership, particularly among younger demographics. Affordability, flexibility, and the amenity-rich experience attract renters who could afford to buy but choose not to.
Coliving demand is driven by affordability (coliving is typically 20-40% cheaper than renting a one-bedroom apartment in the same area), the desire for built-in community, and the needs of mobile workers who want furnished, flexible accommodation.
Institutional Appetite
BTR has achieved mainstream institutional acceptance. Major institutional investors, pension funds, and REITs are significant BTR investors globally. The asset class has a proven track record and established valuation frameworks.
Coliving is earlier in its institutional adoption curve. Venture capital and family offices have been the primary investors. Institutional interest is growing but constrained by limited operating track records, lack of standardized metrics, and smaller deal sizes.
Market Size and Growth
The global BTR market is significantly larger, with hundreds of billions in institutional capital deployed. Growth rates are strong (10-15% annually in key markets) but the asset class is maturing.
The global coliving market ($16B+ in 2026) is smaller but growing faster (20%+ annually). The market is still in the early growth phase, offering higher growth potential but also more uncertainty.
Risk Comparison
BTR Risks
- Interest rate sensitivity (affects both development financing and cap rates)
- Planning and construction risk for new developments
- Market saturation in some cities
- Yield compression as more capital enters the sector
Coliving Risks
- Regulatory uncertainty in many jurisdictions
- Operational execution risk (community management is hard to scale)
- Shorter tenant tenure increases vacancy risk
- Limited exit options (fewer institutional buyers)
- Reputational risk from community issues
The Convergence Trend
Interestingly, BTR and coliving are converging. Newer BTR developments increasingly include shared amenities, community programming, and flexible lease terms that were traditionally associated with coliving. Meanwhile, coliving operators are moving upmarket with larger rooms, ensuite bathrooms, and more self-contained living spaces.
This convergence suggests that the future may not be a binary choice. "Community-centric BTR" or "institutional-grade coliving" may emerge as a hybrid category that captures the benefits of both models.
Which Model Is Right for Your Portfolio?
Choose BTR If:
- You have access to significant development capital
- You prefer lower operational complexity
- You want broad institutional exit options
- You are targeting stable, long-term cash flows
- You are comfortable with lower yields in exchange for lower risk
Choose Coliving If:
- You want higher yields with active management
- You can invest in operational excellence and community building
- You want to enter the market with less capital
- You are comfortable with an emerging asset class
- You believe in the long-term demand for community-oriented housing
Both models have a place in a diversified real estate portfolio. The best investors understand the trade-offs and allocate capital based on their specific risk appetite, operational capabilities, and market outlook.
Written by
Mayank Pokharna
Mayank Pokharna is the founder of Everything Coliving. 11+ years in coliving as an operator, PMS builder (JumboTiger, SimplyGuest), and advisor to 60+ operators across 14+ countries. Listed as a coliving expert on co-liv.org, featured in Forbes India, BBC Punjabi, Financial Express, and Economic Times, and published on the economics of shared living.
Explore Related Topics
Free Tools
Further Reading
Related Articles
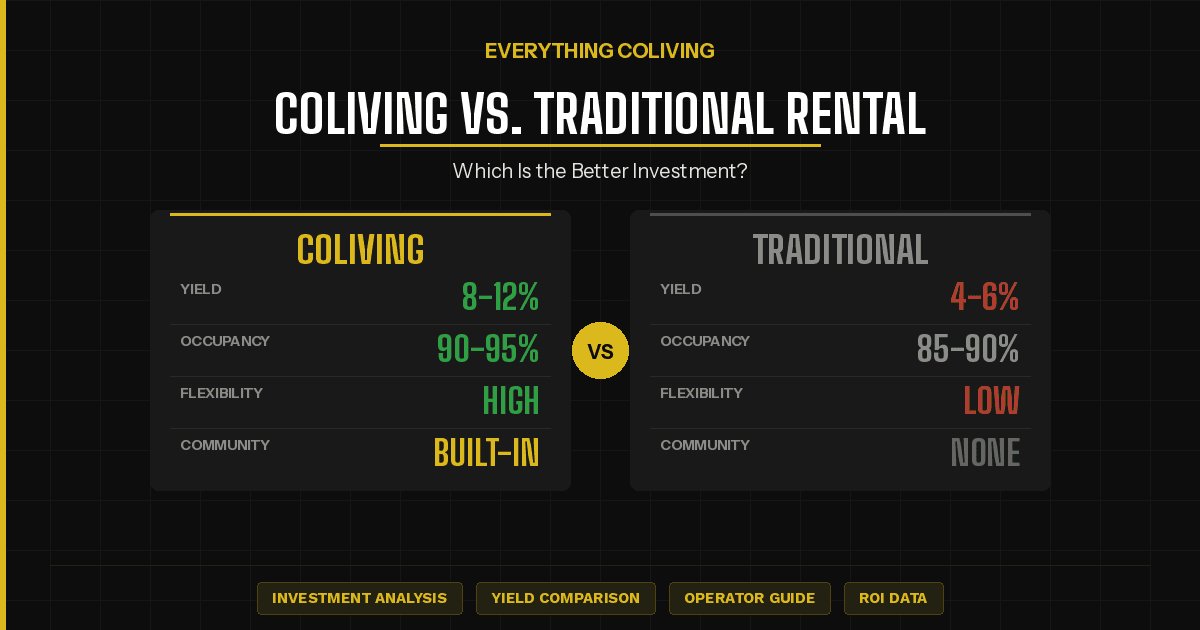
Coliving vs. Traditional Rental: Which Is the Better Investment?
Compare the financial returns, risks, and operational demands of coliving investments against traditional buy-to-let properties.

Coliving Staff Compensation Benchmarks by Region
Regional salary benchmarks for every coliving role including community managers, operations managers, cleaning staff, and maintenance, with compensation structures and benefits.
Coliving vs Student Housing: Key Differences for Operators and Investors
Compare coliving and student housing business models. Understand the operational, financial, and demographic differences that matter for your investment decision.

Tax Deductions Every Coliving Operator Should Know
Maximize your tax savings with this guide to deductions specific to coliving operators, from furnished unit depreciation to community event expenses.

Sustainable Coliving: How to Build an Eco-Friendly Community
Sustainability is becoming a competitive advantage in coliving. Learn how to implement green practices that reduce costs, attract eco-conscious residents, and benefit the planet.